Assembling the elephant … thinking about the Ultimate CMO Dashboard

The whole is more than the sum of its parts (Aristotle). As a marketing leader, you don’t want to just make an impression, you want to show your impact.

images (1)


Let’s cut to the chase: as Chief Marketing Officer you need metrics and results. Otherwise, there is no glory – and no budget or resources for you to help your company succeed. Setting KPIs is today’s mantra for everything you do. But agreeing on which KPIs are relevant is not that straightforward.

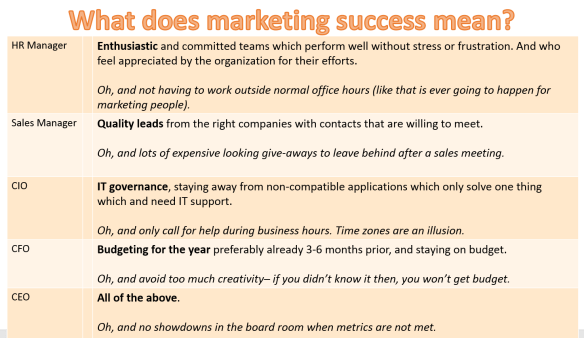
Despite our focus on being data driven and building our marketing plan on data rather than assumptions, aligning with sales objectives and corporate strategy – what we perceive as a successful result may not resonate among our peers. Our KPIs must be based on a joint perception of what constitutes success. Believe me, in large organizations, CMO-life isn’t straightforward:

Success

It’s analogous to the story of the three blind men and the elephant in which each blind man touched a different part of the elephant (trunk, leg and tail) and thus had a different perception of it. (Debbie Quagish, The Pedowitz Group)


TheHikingArtistFritsAhlefeldt

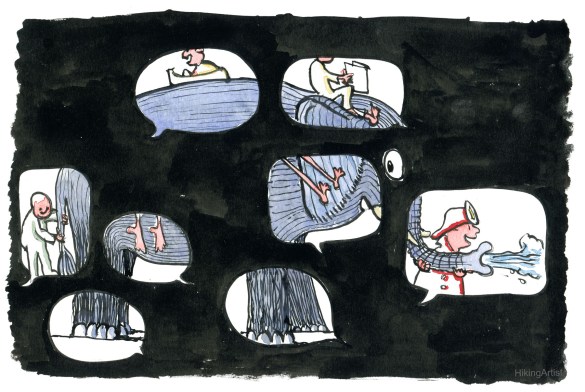
Illustration by Frits Ahlefeldt “The Hiking Artist Project”

So, how can you fulfill all these expectations while controlling your urge to count leads, conversion rates, clicks, opens, and number of attendees at your events?

I am guessing, that this is how you judge your success as a marketing leader today. But other stake holders expect different measures, and nothing is more frustrating for a marketing leader than happily reporting marketing results and then being ignored/unappreciated by the organization.

The dilemma is well known – there are countless “How To Measure Marketing Success” do-it-yourself books, articles, videos and blogs out there for you to sample. But from checking 10 different sources, none of these provided an answer to all of the above. Most – and that makes sense – are focused on the expectations of Sales in order to support creating revenue. But remember, Sales is measured on short term goals, and your CFO wanted your plan in place 12-18 months before it is supposed to be executed.

The ultimate CMO Dashboard

When convincing CFOs, CEOs and board rooms, the trick used to be to show complex pivot tables with an abundance of data that hopefully illustrated achieving your KPIs. But times have changed, and speed is the new currency of business.

You only have seven seconds to make an impression.

But knowing that your counterpart only has a slightly higher attention span than a goldfish, you have about eight seconds  to make an impact.

So, skip the pivots and show The Ultimate CMO Dashboard:

CMO Dashboard 2

You know you want it. (Source: Musqot Marketing Technology)

It has all the components you need in order to assemble the various parts of the elephant. The dashboard reports on budget, progress according to plan, activities planned and status, and much more. You can slice it the way you want. The application is called Marketing Performance Management (MPM) and is developed by one of Sweden’s exciting startups, Musqot Marketing Technology.

The benefit of an overview like this is that it takes only 8 seconds to process during a meeting where the CMO holds the last spot and only has 12 minutes left from the 20 minutes she was allocated on the agenda.

Another clever aspect is the fact that it provides a holistic view of marketing execution, CMO Dashboard 1based on real time data. For example, the planning section is built upon the familiar concept of Gantt charts while in the same view you have the updated results from the various activities displayed at the bottom – taking Gantt to the next level so to speak.

Musqot’s current tagline is “Control Will Unleash Creativity” and speaks to exactly what marketing is all about in the enterprise: being able to creatively support the strategic objectives of a company while maintaining control over planning, budgeting and execution. So, basically you are combining the parts of the elephant into … a whole elephant … rather than a snake (the trunk), a spear (the tusks), a piece of rope (the tail) and a leathery sheet (the ears).

There is a catch

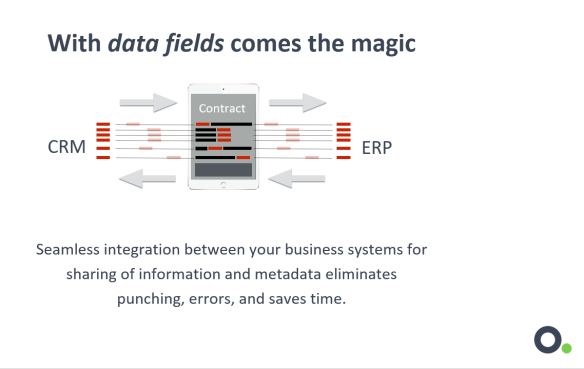
If you want to visualize data driven planning, progress and results, you need to have the data available in a consolidated environment where the various sources are seamlessly integrated. Despite being the ultimate tool for marketing finance and performance management for the enterprise, you will unfortunately need to reside and consolidate everything on the Salesforce platform. It’s not an easy nut to crack, but to work with data means that the data needs to be compatible regardless of its source. Especially if you – as in this case – have real time visualization and insights to gain.

So, to reap the benefits of the ultimate CMO dashboard, you would need your data to be sourced from and consolidated on the Salesforce platform. Which is why Musqot is a featured application available on the Salesforce AppExchange.

But if you measure – and show – marketing success in a format that ties it all together like this, where activities are directly associated with sales success, the sales manager may just stop asking you to organize huge events and request more long time planning and engaging campaigns that are timely based upon the actual needs of the future customer. So now both Sales and Finance recognize your marketing success.

By consolidating your data, your activities and your results on one platform that is integrated well into the company’s IT backend, the CIO will recognize the success of your marketing activities.

And if everyone else is pleased, so is your CEO. Especially since you did not bore her to death, and succeeded in presenting your update within the eight seconds you had to make an impact.

Signed, sealed and delivered

moderndatasolusi

Document workflow is about converting data into valued transactions

Documents are at the core of successful businesses. We all get carried away by technology, so we tend to forget that the deal itself between a vendor and his customer is signed, sealed and delivered on a document. Okay, we can keep it digital. But a digital document is a document, nonetheless.

Digital is much more complex to handle than paper – you have data, you have tasks, you have interactions, you have compatibility issues. And no time to consolidate it all.

FlowOneFlow

Oneflow Collaboration Chart (Fluido Salesforce Innovation Hour)

Just think about the documents required to manage all of these! Each of these functions on this collaboration chart created by Oneflow also require legal compliance. Things that keep you awake at night such as revision tracking, signatures, data privacy, product liability, auditing and archiving. OneFlow’s way is to offer a document independent workflow of actions and interactions that only combines into a document as we know it when it is consolidated and sealed.

During each of the steps in the Oneflow application, the data is enriched, the cycle progresses but nothing is locked down until it is required – i.e. when a legal contract is signed by two parties.

StartFinishOneFlow

Oneflow Workflow for Contract Handling


When I got my first typewriter with correction tape in 1984, the technical documentation I was creating became both more accurate and looked nicer. And the interface was easy – you just had to avoid making changes after you had pulled your A4 out of the machine.

From a user perspective, the correction tape in a typewriter has been replaced by data points enriching the content that becomes the document. datafields

It’s no use if you don’t use it

Today, you interface with your operating system, your application and your selected platform – hoping that it will support the previous two.

In a very recent survey conducted by Documill among document automation experts and system integrators, the message was quite clear: It’s all about ease of use, content and branding/template support. (I bet they asked the actual users, not the managers.)

EaseOfUseDocumill

Speaking about users – and platforms – the marketing mantra for document workflow solution vendors has always been seamless integration. But it is never seamless, and the platform is where it all comes together. So, even if you have a document workflow solution that liberates you from the paper in the typewriter, you still have to fit the details together and keep them up to date.

Documill Dynamo simple Salesforce data mapping numbered

Using a document workflow solution like Documill Dynamo especially created to seamlessly integrate with the Salesforce platform is one way of ensuring trackability, brand and collaboration within the Salesforce universe. It’s datadriven, collects the components of a document directly from real time data sources, and allows for all the benefits of collaboration that is the DNA of Salesforce. The outcome is a nice PDF – which is just an even better version of my A4 in the typewriter.

Although I am certain that this will change when our tablet kids are conquering the business world:

My grandson (aged 4) walked up to a huge e-display at the airport and tried to swipe. Then he told me, it was broken.

Ease of use is key even when it comes to selling tools. A tool is useless if it is not used. You need to interface with your data the way you interface with your phone or tablet. Let’s swipe, dictate, command and scan to enter and work with the data in your sales tool. That way you will actually get it done.

Some of us may probably end up having withdrawal symptoms and look for ways to scan our documents and to integrate our tools into our comfort zone such as Outlook. But you are just adding another layer of complexity and more applications to time manage.

“Too many sales tools are still desktop-oriented. As consumers, we enjoy doing stuff on mobile. When we go to work, why would we want to specifically boot up a computer? In five years time there won’t be one single end-all tool, but several tools that work seamlessly together during different sales pipeline phases. Data, digitalization and automation will take over.”

Blogpost by Finnish innovator Zero Keyboard quoting Nikolai Pietiläinen of Varpaus Bikes (Cycling-as-a-Service)

Do it when it’s top of mind

This is where a clever solution called Zero Keyboard comes in. Zero Keyboard let’s you enter data on mobile, manage your sales activities and update business systems without typing. It is currently marketed on the Appexchange and runs on the Salesforce CRM platform, but the concept is a winner: you manage your data and your tasks by swiping, voice command and scanning. Take a look at what I am talking about on this video.

Even my grandson could do it. And he probably will, once he’s grown up.


2b7a33f3194d13514da5e1fe8a16138c


The Fluido  Innovation Hour on April 23 (online event) brings together some of these offerings needed to create a meaningful end-to-end document driven business, using Salesforce as it’s platform. From marketing, sales and support to collaborative contract handling and closing the deal.

Credits

Featured Image by RICOH distributor Modern Datasolusi

Selected images and research by Documill, OneFlow, Zero Keyboard


Print is not dead – it’s alive, and thriving in Greece

When a catchy phrase such as ‘Is Print Dead’ has caught your attention, you start to see it everywhere. Some see pregnant women and prams. I see print shops. In Thessaloniki, they were abundant.

A struggling economy recovering from failing infrastructure and hardships for both businesses and private indviduals:  Greece illustrates that print is still the carrier of civilization and growth.


What is the best course of action when your finances are tight?

Most people would answer: You cut back on your expenses. But that does not help you out of your demise, it just helps you stay in the mud without sinking any deeper. At least for a while. But what if you choose to grow your own money tree – or rather develop new ways of working that alter the course instead of treating the symptoms. In the case of a business – or a country – the way forward is not mindless cutbacks but disruption, innovation and finding those new opportunities.

Greece26

There is lots of room for improvement here, if you dive deeper into the European Commission 2017 Digital Progress Report  which places Greece in 26th position (of 28 total) among European Union member states on the Digital Economy and Society Index (Greece is abbreviated EL).

How to disrupt, innovate and grow in a crisis

The answer seems obvious for anyone in the printing and business communications industry: We communicate and interact using the most efficient available channel of communication. In Greece, it seems, this is still print.

Since the ecnomic crisis in 2012-2014, the penetration of digital in small and medium sized businesses (SMEs), family-owned shops and public life as well as governmental instutions remains considerably lower in Greece than I have seen elsewhere in Europe or Overseas. There were no opportunities to make investments in the early days of digital in this harsh climate for both businesses and government. And SMEs were hit hard. The 2014 policy document The Development of SMEs in Greece by the National Confederation of Hellenic Commerce states:

“According to the latest EU annual report on European SMEs for 2013, the SMEs of states which are vulnerable regarding public debt are facing serious problems related to liquidity, job losses and lack of value added. The only sector not affected by the above problems is the high technology (High Tech) sector. It seems that the countries which have established a solid and comprehensive approach to the implementation of SBA measures and policies are more able to support SMEs during the recession. SMEs in Greece are currently in the fifth year of the economic crisis. Despite the fact that Greek governments have implemented certain policies for SMEs (Investment Law No 4072, Creation of private capital companies, supporting self-employment, etc.), it is clear that Greek SMEs have been affected severely and to a disproportionately greater extent as compared to large enterprises.”

Now, you would argue, service providers like print shops are quite often classified as SMEs and should be as severely impacted as their buyers. But printing is part of the recovery.

A 2016 analysis of the value added annual growth of SMEs (non-financial) by EU member state shows a devastating -1.0% for Greece as the only contender below the line:

minus

But if you dive deeper into the data, Greece also shows the highest growth contribution from business services which include printing: 46% annual growth in 2016 for SME business services (compared to the EU-average of 18%)

46

Print is not dead nor will it ever die

606px-Charles_Frederick_Ulrich_-_typesetter_at_Enschede_Haarlem

Charles Frederic Ulrich (1858-1908): The Village Printing Shop, Haarlem

Walking down the narrow streets of Thessaloniki, my eye caught the numerous book shops, magazine stands, and posters glued to the wall of every building that had some available wall space exposed to the people walking by.  Flyers were stuck into the door handles of every apartment building every morning – and just as often removed by the inhabitants – replaced the next morning with a new message, a new service, a new special offer of the day.

We were offered flyers, brochures, political pamphlets. And every 5th-10th shop was a copy shop, a small or medium sized print shop, digital or offset printing. There was a whole street with only print shops on top of the yet to be excavated ruins of Galerius’ Byzantine palace. And TYPO in Greek means what we think it should mean.

It’s not the print that is disrupting or helping Greece back on its feet, but it is the carrier of the messages that those who change, innovate and grow need to spread in the most efficient way available to them. If you are a small startup, if you are medium sized retail or manufacturing business, you cannot pay for expensive online advertising or TV ads. If you are a small non-profit or political movement funded by enthusiastic supporters, you cannot reach the masses through digital media alone.

You spread the news on paper.

Because paper is durable, flexible, ubiquitous. You can leave it on door handles, hand it out to people in the street, glue it to the walls of popular sites, send it as post cards, sell it as books. It does not disappear with the wink of an eye – or a click of a finger on a scroll button.

It still does not guarantee that your message is read or your acted upon. That remains the task of the content provider to ensure. But it certainly reaches your audience, if you know where to put it.

Beating the Kobayashi Maru – or the human vs machine experiment with Watson

“I don’t believe in no-win scenarios.” (James T. Kirk, Starship Captain)

When you are a strong believer in datadriven decision making, building strategies on real insights, and always sticking to facts rather than fiction – it’s a hard blow when one of the world’s leading artificial intelligence systems tells you, that you are not a nice person. It’s based on data – so it’s a fact.

Many industry leaders have evangelists who are excellent presenters and subject matter experts. It’s always a privilege when you get a chance to interview an evangelist. I met IBM’s Rashik Parmar, Watson evangelist, at IPExpo Nordic a few weeks ago.

WatsonDescription.png

Source: IBM

There is so much potential for big data analysis and the learnings and insights we gain, from combining the many available sources of accssible data to draw new conclusions and find answers. That’s basically what Watson does. And then makes the logical connections. Simply put.

IBM developed a small demo engine that would analyse your Twitter personality and generate those awesome charts we all love; and few of us know how to interpret. It was reassuring to see what a nice guy President Obama is on Twitter. And my friend, Rashik, had a similar profile – so all good.

Potus.png

Source: IBM’s demo app TweetMeWatson

Lucky for me, we couldn’t make it work for my profile until I got home. When I ran it, I found out I was

“Inconsiderate and a bit shrewd”

I will spare you the rest. Either I am very delusional about how I express myself, or there was something fishy going on here. But it’s based on data! It has to be true!

Before digging a hole in the garden to hide from the world – or the equivalent: deleting my Twitter account – I decided to think it through. What was Watson picking up on, what were the actual parameters used?

The Big Five (FFM) Personality Traits

Watson is grouping our personalities according to the Five Factor Model (FFM) Wikipedia explains:

The Big Five personality traits, also known as the five factor model (FFM), is a model based on common language descriptors of personality (lexical hypothesis). These descriptors are grouped together using a statistical technique called factor analysis (i.e. this model is not based on experiments).

This widely examined theory suggests five broad dimensions used by some psychologists to describe the human personality and psyche.[1][2] The five factors have been defined as openness to experienceconscientiousnessextraversionagreeableness, and neuroticism, often listed under the acronyms OCEAN or CANOE. Beneath each proposed global factor, a number of correlated and more specific primary factors are claimed. For example, extraversion is said to include such related qualities as gregariousness, assertiveness, excitement seeking, warmth, activity, and positive emotions.

220px-francis_galton_1850s 
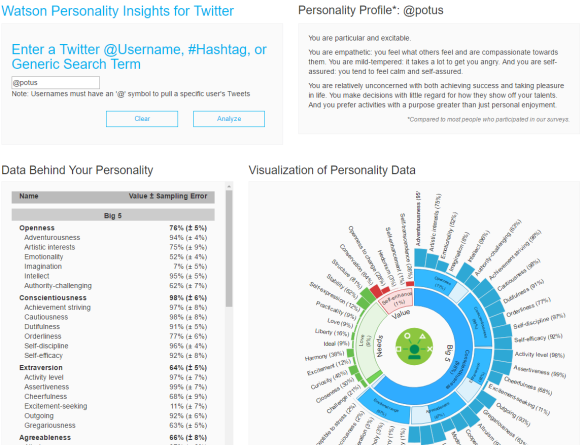
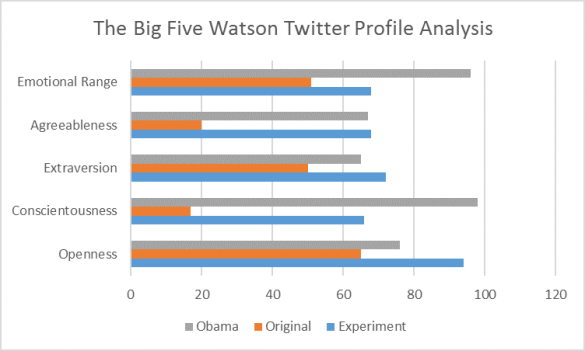
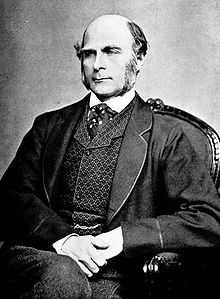
It all sounds very reassuring, the term “Lexical Hypothesis” makes sense –  it was analysing words. This is a principle which was developed by British and German psychologists to identify a personality characteristic. It was used to determine risk of mental illness or criminal behaviour. Invented in 1884, by the way, by Sir Fancis Galton – a stern looking fellow.

But something as elusive and intangible as the human mind is so very hard to classify and illustrate in data points and charts. By creating a lexicon of words and adjectives that at the time were considered to be indicators for certain behaviours, they provided a tool to build profiles – and categorise people based by their choice of words.

Note that the method has also received a lot of criticism – many of them quite reassuring when you are on the receiving end of this exercise. Read more here. 

Phew – that means I can still be a nice person, just not when I tweet. Or speak.

It seemed safe to climb back out of the hole in the garden and meet the world face on. But knowing now what triggered my unpleasant profile, I decided to challenge Watson to a duel.

A duelling experiment

kobayashi-maru-02

@echrexperiment is the experimental Twitter profile where tweets were worded more carefully, where people and followers were thanked and nothing bad was happening in the world. No politics, no injustice, no gender inequality, no discrimination. And lots of cats.

exhrexperiment.png


After three weeks, I was a much nicer person. The traits that I seem to be exploiting negatively in my original profile are now contributing to a positive image.

Suddenly, uncompromising was a good thing.

Spock.png

“In academic vernacular, you cheated”

Like Captain James T. Kirk in Star Trek challenging Mr. Spock’s designed program, I cheated to win.

Most of my tweets were carefully drafted using positive semantics but remaining true to my usual topics of interest. I was not trying to be someone else, just focusing on being nice. Here’s a list of the parameters I introduced to make Watson love me more:

  • Following back – anyone who followed me, unless an obvious business account or egghead, was followed back as soon as I spotted them.
  • #FF – sometimes I used the FollowFriday hashtag to thank select people. It generated some nice interactions even between those mentioned, so I grouped them into categories – e.g. Danes, analysts, etc.
  • I thanked, and loved, and “awesome’d” and “great’ed” a lot.
  • Sharing – giving credit, not taking it. I always mentioned the source or the account where I had picked up a link.
  • Sharing the love – retweets were focused on positive news, positive sentiments and uplifting current events. I also checked the wording of the original tweet before RT’ing to avoid contamination of my positivity.
  • Getting personal – my personality and emotions were conveyed more by sharing private interests such as books, cats, travel and science fiction.
  • Language Disclaimer – all of the above choices were based on my non-native perception of the English language, and may have been different from Webster’s Dictionary which is the basic semantic interpreter used in lexical hypothesis.

What I didn’t do

Humour doesn’t travel well, so any jokes, irony, satire and cartoons were not part of echrexperiment. I may have gotten carried away occasionally, but consciously tried to avoid it.

Politics are a powerful emotional trigger, so I avoided RT’ing or engaging in conversations with political statements. That wasn’t the mission.

Automation is a powerful tool to increase the quantity of your social media posts, but with automation things like timing and engagement suffer. Sometimes, due to other news, automation may even lead to displaying insensitivity.

Automatic response is a convenient way to further promote your services and invite people to connect. But it just isn’t personal. Despite all these lovely people addressing me by name. I did not send messages to thank people for the follow, but I checked their profile and retweeted where I could to show my appreciation.

What Watson had to say about @echrexperiment

The app itself produces a lot of detail as you can see from above. Below I grouped the result into more familiar charts to share some highlights. To make sure I picked a really nice person as control, I chose President Obama’s Twitter @potus. But please remember – it’s probably mostly his staff tweeting. And they seem to have done an excellent job.

watson1

Obama – it appears – is very agreeable on Twitter, and my experimental lovely/nicey/catsy account matches this impression very nicely. We are both very open, although I am lagging on conscientousness, but hey –  I am not the President.

Digging deeper into selected parameters, revealed some interesting characteristics related to being a President or just trying to be a nice person.

We can all agree that values should be an important parameter if you are President of the United States. Strangely enough Obama wasn’t all that keen on change, and more inclined to be conservative. For self enhancement … we have identified the villain – the one parameter that makes my original Twitter account so repugnant. I leave the graph to stand on its own.

Meanwhile, President Obama scored a resounding Zero on self-enhancement – but he made it to the top already.

watson2

President Obama’s most distinguishing need is the need for structure. Love – it seems – he gets a plenty.

On the other hand, my original self seems to have enough structure in her life.

Watson3.png

But here’s the greatest insight from this entire exercise – other than confirming that it is possible to change who you are, or rather how you are perceived:

When it comes to curiosity, all you need to do is be a positive tweeter and include lots of cats.


IMG_0042.JPG


Rätt Data i Rätt Kontext

businessman hand holding colorful transparent glass cubic

Introduktion till nätverket Digital CMO

Av Peter Johansson

Digitaliseringen har gett marknadsföringen tillgång till mätbara data och drivit branschen ljusår framåt. Men det ligger en utmaning i tolkandet av dessa data. En utmaning som nya nätverket Digital CMO har tagit sig an.

Reklambranschen är en av de branscher som anammat digitaliseringen på mesta sätt. Idag har reklambranschen inte bara en uppsjö nya digitala kanaler att rulla ut sina budskap via, de kan även bygga sina kampanjer och mäta deras resultat med en precision som snuddar vid individnivå.

Det varma mottagandet av digitaliseringen kommer av naturliga skäl: Det datadrivna tankesättet är en grundstomme i marknadsföringen. Att använda kunddata som verktyg för att skapa relevanta budskap är vad jobbet går ut på, så att säga.

– Data som styrmedel för kommunikation är något som alltid legat naturligt för marknadsförare. Man har ju alltid jobbat med att ta fram sina målgrupper, definiera vem man ska prata med, i vilket sammanhang och sedan tajma det, säger Elisabeth Bitsch-Christensen, nätverksledare för Stockholmskretsens nystartade nätverk Digital CMO.

Inte bara data, data, data

Det gäller dock att inte stirra sig blind på siffrorna. Det finns otroligt många stand-alone verktyg som alla på sitt sätt utlovar Utopia. Men det räcker inte med data på ett pie-diagram som visar vad som har hänt. Det verkliga värdet av dina data kommer först när de tolkas utifrån ett relevant sammanhang. Som den amerikanska tidsskriften Forbes beskrev det när de nyligen vände på statistikern W. Edwards Deming klassiska citat ”without data, you are just another person with an opinion”

till

”Without an opinion, you are just another person with Data”.

– Vad vi behöver är system som sätter detta i perspektiv, som ger bakgrund och kontext för den data som visas, och som lägger till aspekter som mänskligt beteende, makro- och mikroekonomiska faktorer och disruption. Vi behöver skapa insikt av data och applicera det till företagets utveckling och mål, säger Elisabeth Bitsch-Christensen.

Hur kan nätverket hjälpa till?

– Det finns otroligt många kloka människor i Stockholm och Sverige som har tagit till sig detta tankesätt från den ena eller andra vinklingen, och dessa människor behöver ett forum där det kan möta kolleger och stakeholders.

Därför har hon startat nätverket Digital CMO. En första träff hölls i september och ytterligare tre träffar är spikade under hösten. Närmast, den 7 november, fördjupar sig nätverket på affärsnyttan med beteendedata. Elisabeth Bitsch-Christensen har bjudit in Mikael Karlsson från Dagens Analys och Andreas Quensel, analyschef på Expressen.

– Vi kommer att bjuda in föreläsare, och själva berätta om våra erfarenheter. Vi tittar på trender och fördjupar oss i rapporter. Vi kommer att kommer att ha kul också, det är en viktig del av marknadsförarnas vardag, avslutar Elisabeth Bitsch-Christensen.

Make your Market Data Speak – and become a sales hero

Let’s all agree: Marketing is a strategic and mission critical function in any business. But unfortunately, this is rarely recognized. To prove your value as a marketer, show that your marketing investment supports the business.

810x430-data-driven-culture

The ongoing discussion about ROI and metrics is sidelining the key issue: It’s no longer enough to measure number of leads generated in push-campaigns, you need to measure engagement and generate quality behavioral data. Marketing contributes to business strategy and growth. And you – the marketing professional – can become a hero for the sales organization by turning the data into valuable insights.

What we as modern marketers need to do is to focus on the business and how marketing can be even more successful through collecting the right data to work smarter and engage the right audience. For me, it’s always been about the data. And luckily for me – it’s available from just about everywhere. Marketers need to take the front seat in the digital era and learn why and how data driven decisions make a difference for marketing impact.

“Customers today expect—and demand—a seamless and relevant experience,” says Teradata. “They have grown accustomed to marketers’ knowledge of their preferences and anticipation of their needs. Fractured or conflicting messages from a brand make marketers seem unorganized and annoy customers, sometimes even driving them away.”

The topic of data and marketing is making it’s way into the board room, and decision makers require market and customer centric data to guide them.

Johanna Lindskog Lindell, a Swedish data strategist and PR professional, explains:

“Just like your company, your customers leave a digital trace. Customers expect you to know and understand their interests and preferences. With each interaction between you and your customers, they become more and more open and transparent exposing their behaviour and interests. Make use of these insights so that they can become the building blocks of your business.”

Easier said than done

In his blog in June, 2015 Jonathan Buckley of Qubole provides some useful insight on what it takes to create a datadriven culture in the enterprise, emphasising the need for both visionaries, tools and accountability in the process. But not all of us are sitting at the big round table, and for marketing to take a seat where visions turn into strategy, there is a both bottoms up and top down approach.

Johanna is a major influencer in the Swedish PR-world. In her regular blog on Resumé, published by Bonnier Business Media (in Swedish) she elaborates on how to build a datadriven strategy that keeps you out of trouble and gets you closer to the board room when decisions are made:

  1. Consolidate your data

Combine the data available in your organisation to drive strategic decisions, understand your customers and the perception of your brand. To strengthen your brand, you need to understand your position in the market…

  1. Listen

Success depends on how well you identify and understand your customers by letting their data speak to you. It’s not just about your brand and what you want to communicate. By listening you will understand what type of problems people want to solve, and what interests them. These insights are invaluable for your business.

Johanna

  1. Develop strategic campaigns

By listening you will gain insights and understand what drives your customers, what their engagement is about and how they perceive your brand. Using this data you can create strategic activities which can be applied to your entire organisation.

  1. Optimise and improve, try and try again!

Optimise your campaigns as you go by interpreting the information shared by your customers, and stay focused on customer driven marketing. Most companies and most people want to see metrics after a certain time period. I prefer comparing data with yesterday’s data. Mostly to see how well I have succeeded, what I can optimise and what I can improve.

What’s a petabyte?

So what is datadriven marketing? It is the creation of value that supports business objectives and your strategy. And it’s really quite mind boggling, how much data we as marketers have access to.

cartoon-turkey-data-science


In less than five years from today, experts predict that our annual data creation will reach nearly 45 trillion gigabytes, that’s 45 million petabytes. The human brain is estimated to store the equivalent of 2.5 petabytes of binary data. 2.5 versus 45 million petabytes.

You could also say that the available data in the world is more than what is stored in the brains of the entire population of – say – The Netherlands.

With all this data available to individuals, corporations, and governments, you will benefit hugely if you build your marketing strategy and execution on data.

When data is leveraged brilliantly, it can reveal highly useful patterns and trends. And you will find things to improve, not just in marketing but in other business functions as well.


Success is about balancing data, art and poetry

Some people – including many marketers – think data is dull and boring. I don’t. Data has poetry when you know how to look. To let it speak to you is  pure art; it will help you develop a successful datadriven strategy.

Nonsense


For a while now I have been struggling with definitions and perspectives on the enigma of datadriven marketing. There are so many different skills involved – and so many departmental functions that hold a stake. To understand the confusion, you might like to read my previous post What is Datadriven Marketing Even the dictionaries, let alone the stakeholdes themselves, are struggling with the term. From a marketing perspective, however, there is a clear purpose:

Datadriven marketing means capturing and analyzing data from the abundance of available transactions and interactions between you, your company and your market – and turning them into meaningful conversations that engage your audience.

big-data-cartoon-100000-warehouses

Click here for more of these excellent cartoons.


Datadriven marketing is pretty straightforward

“This is what works: being clear about a Call to Action, knowing your audience, crafting content that’s got a story to it, measuring and analysing results and adjusting based on the data.” (Jim Rosenberg, Chief Communications Officer at Accion)

There are some key words in this statement which have evolved into separate – and rather hyped – marketing disciplines:

  • Know your audience – the hype word here is personalisation
  • Content with storytelling – the hype word is Content is King
  • Measuring and analysing results – the hype word is Business Intelligence

What perplexes me is that each of these components seem to be addressed separately depending on what is the hottest trend on the various expert forums and conferences aimed at marketers. Add the #InternetOfThings to the mix and it gets even more disassociated from the real business purpose of marketing.

Getting personal

What if marketers listened to their data before they applied it to a mailing list with names, company size and job title? Personal contact information provided over completed online forms tends to be incorrect, flimsy and incomplete. Often it is  contaminated in the mailing application by duplicates and record matching, and the risk of antagonizing the recipient is real.

Personalisation should not be about getting the name and job title right, it should be about getting personal to the extent that the timing, the message and the format is relevant to the person receiving the communication.

Get aligned – or perish

What if marketers worked their way backwards from the business objectives to the content that was needed and embraced by the sales organisation to achieve them?

Studies show that despite “Content is King”, many sales teams do not fully utilize these carefully drafted assets:

Only 9 percent of content created in enterprise marketing departments is viewed more than five times by the sales department, according to Docurated’s latest State of Sales Enablement report.

Apart from an apparent lack of strategy around content creation, marketing and sales teams are not communicating and appear to be creating content in silos. Read more here.

How to turn metrics and analyses into actionable insights

The good news is that organizations are collecting and creating more data, but they also have better analytics tools and techniques available. The bad news is that there can be too much of a good thing. Paul Blasé from PriceWaterhouseCoopers explains it like this:

“For example, they (…the senior management…) can debate, ‘well why did the market grow at this rate when I assumed [it would grow] at this rate; or why did this competitor gain share versus me, when I assumed the opposite would happen because I dropped my price? It’s about combining the intuition and the experience with the science of data analytics together to help an executive team make better decisions, and that’s where we’re seeing traction.”

The challenge is to allow the poetry to enter the discussion – expressed by Blasé as combining intuition with experience. Because what characterises these questions is that executives tend to address historical data with lagging indicators and based on KPIs and other metrics they defined not from insights they need, but from data that is available to them within the scope of the reporting and analytics tools that they currently use.

The Harvard Business Review conducted an interesting study among graduates who were in positions where the focus was on researching competitive intelligence. And concluded that only half of the companies actually use the competitive intelligence that they collect.

Why? Because when decisions are made, he or she who shouts the loudest, normally defines the game. So if data is collected and interpreted only to reconfirm an assumption or justify a strategy already defined, or if the actual data provides insights that are countering the loudest shouter, management may end up making some very bad decisions. But you can turn it around – if you listen and understand what the data tells you, successful decisions will help your business and your career. One of the examples from the Harvard Business Review study is from a pharmaceutical company that used the data to make business related decisions:

A common theme across industries was the smart reallocation of resources. One analyst told us that their company had stopped development on a project that was consuming lots of local resources after the analysis indicated it wouldn’t be effective. They then re-applied those resources to an area with true growth potential — that area is now starting to take off. In a different company, an analysis led to the cancellation of an extremely high-risk R&D program. (Benjamin Gilad, Leonard M. Fuld, Harvard Business Review Jan 28, 2016)

Read more about why organizations struggle to get data cultures right in this article by David Weldon from Information Management.

torturing-the-data3

From chaos to order

In the second half of this video  the SBI (Sales Benchmark Index) Revenue Growth Maturity Model defines the evolutionary flow from data strategy chaos to order:

  1. Chaos – the organisation has a corporate data strategy but it is not translated into a functional direction.
  2. Defined – there is both a corporate and functional strategy, but they are not implemented.
  3. Implemented – now, the strategies for both corporate and functions are implemented but remain separate entities and not aligned.
  4. Managed – now we have aligned the strategies to run the organisation with a defined goal and actionable insights
  5. Predictable – aligned both internally within the organisation and including and integrating external data sources from the market.

According to SBI, 51% of US companies are still at level 1 – in a chaotic environment where strategy is neither communicated nor aligned with the business.

That is the pitfall that digital marketers must avoid – the disalignment of business objectives and marketing strategy.


How to win presidential elections with a digital strategy

“If the Democratic party were a body, Bernie Sanders would be the heart and Hillary Clinton the brain”

No one expects the Spanish Inquisition – and initially, nobody expected Barack Obama to have a real chance – even more so to get re-elected for a second term. What was his secret? It was being both the brains and the heart.

His method was using data to gain insight into what people care about and address that issue at each and every rally right there and then. When the issue was burning the most.

For us non-US observers it is worth remembering that the key to winning the candidacy as well as the election is not necessarily winning the votes of those who walk to the ballots. It’s about engaging those who wouldn’t.

A datadriven digital strategy

A datadriven strategy enables you to identify the issues that engage your audience.

For his first term election campaign, Obama succeeded in engaging a generation – the generation of social media which was just about to take off at the time.

RomneyObama

He was the first major political candidate to understand the power of sentiments and the power of the voice of the people outside the established channels such as television and news anchors.

By 2012 for the re-election he – or his team of advisors – had understood the power of using data to refine the message and making it timely.

The power of the crowd

As I am writing this article, the final numbers for Iowa have not yet come in, but it is a 50-50 race between Bernie Sanders and Hillary Clinton. In social media, Bernie Sanders has won (according to this Reuters analysis.)

U.S. Democratic presidential candidate Bernie Sanders raises a fist as he speaks at his caucus night rally Des Moines

Bernie Sanders raises a fist as he speaks at his caucus night rally Des Moines. REUTERS/Rick Wilking

Sanders was mentioned 77,000 times versus Clinton’s 55,000 times (Brandwatch) and gained 15,699 new Facebook followers on the one day. Clinton’s Facebook page only came third with 6,210 new followers that day, trailing Donald Trump’s 10,704.

As in all data, one must not jump to easy conclusions and take the number at it’s face value. There can be many different reasons why someone chooses to like a Facebook page – you could be liking an opponent to observe and learn, or to troll and create a disturbance. The second level of such an analysis should therefore always be a sentiment analysis and catalogueing the social media influence of these new followers to be able to conclude credibly whether this will impact a future election result.


ObamaNew

But one thing is certain – you could easily turn the intelligence gathered from this analysis into a practical campaign such as Obama did. One example is given below where the objective was to engage would-be supporters who just had not registered to vote with BigData combined with TV advertisement.

DigitalStrategyPresidentialElections


I can’t wait to read more analyses on how the candidates fare by making their data speak. May the best data whisperer win.


More interesting links to the impact of social media on US elections:


Marketing Tips and Tricks

The three touch engagement strategy for audience acquisitions at business events: Idea – Engagement – Push

Source: Where is everybody – where’s my ROI? Tips and Tricks to attract the right audience at your event

Where is everybody – where’s my ROI? Tips and Tricks to attract the right audience at your event

If you read my previous blog entry, you may still be looking for the best way to find the golden audience that makes you best friends with the sales teams. Here are some suggestions I have collected over the years:

123image

Plan with the end in mind

  • Don’t just set a date, build a 3-touch-strategy together with your stakeholders (the sales teams in most cases).
  • The theme and message has to promote and strengthen the conversations that your sales teams are having with their target prospects. Don’t push some new message or vision down their throats if this is not what their targets are interested in.
  • Be flexible – if the conversation has moved over the 8-10 weeks of planning before the event, make sure to have alternatives ready to add to the speaker list.

Email marketing – and other channels

  • Don’t publish it all at once, when you start the invite process – build an engagement staircase with at least 3 touches.
  • Expand your email campaign with social media engagement through dedicated, branded Linkedin groups, with a short, recognizable and easy to remember hashtag to use across channels before, during and after the event.
  • Another great tip is to prepare your tweets and posts so that your colleagues across the company can share without sounding like a marketing machine.
  • Make it personal, local, fun – whatever their preference is.

For your email campaign – here are the three touches I would recommend:

Image 1

Launch the idea of an event and pre-announce the date. Get the theme out there to gauge interest from your target audience. If you have a star speaker name, don’t let the cat out of the sack just yet. Have a call-to-action button for “sign me up” or “tell me more” – and make sure there is a response on the second one.

image 2

First real invite – allowing people to sign up based on an agenda with topics and speakers that are “glocal” – have a global vision but either are local or have local recognition. Always have a button “sign me up” and “tell me more” to encourage a dialogue.

image 3

Now let the cat out of the sack. Make a big boom invite only promoting date, theme, agenda and your star.

Less is more – let people click through if they want to deep dive into agenda or speaker profiles etc. That way you can capture who is interested so that your sales teams can follow up with personal emails or telephone calls.

Still not there? Time to call the cavallery

And if all fails – if you have not met your quality registration target – go the extra mile – engage with your sales teams, show them the gap between their expectation on the attending audience and their sales target accounts.

Give them a cheat sheet with talking points about the event.  Remember, you know everything about how great it will be – but they probably don’t event know the speakers or content in detail yet. Get them excited, build a dashboard or some other gamification element to let them compete with each other (and make sure there is a decent prize for the winner, so get that on the budget from the very beginning).

Help them help you succeed.