
Some people – including many marketers – think data is dull and boring. I don’t. Data has poetry when you know how to look. To let it speak to you is pure art; it will help you develop a successful datadriven strategy.

For a while now I have been struggling with definitions and perspectives on the enigma of datadriven marketing. There are so many different skills involved – and so many departmental functions that hold a stake. To understand the confusion, you might like to read my previous post What is Datadriven Marketing Even the dictionaries, let alone the stakeholdes themselves, are struggling with the term. From a marketing perspective, however, there is a clear purpose:
Datadriven marketing means capturing and analyzing data from the abundance of available transactions and interactions between you, your company and your market – and turning them into meaningful conversations that engage your audience.
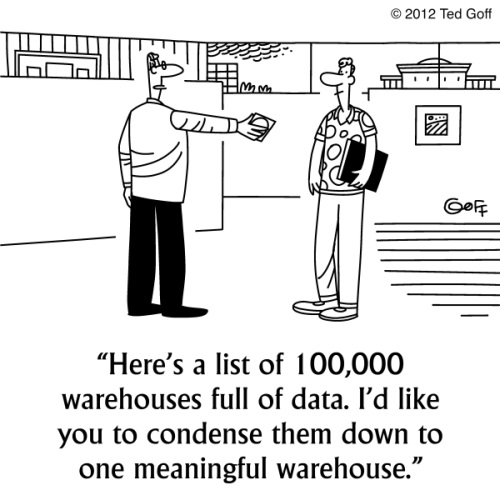
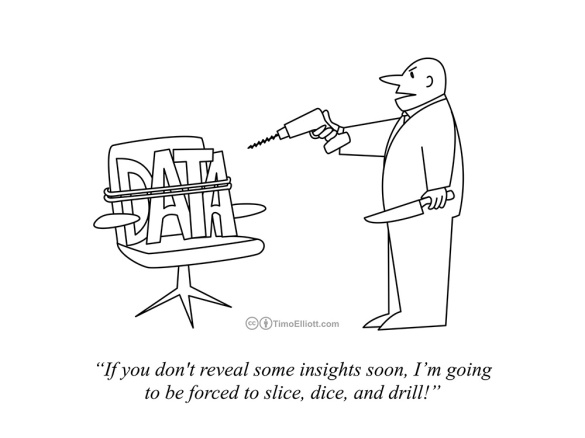
Click here for more of these excellent cartoons.
Datadriven marketing is pretty straightforward
“This is what works: being clear about a Call to Action, knowing your audience, crafting content that’s got a story to it, measuring and analysing results and adjusting based on the data.” (Jim Rosenberg, Chief Communications Officer at Accion)
There are some key words in this statement which have evolved into separate – and rather hyped – marketing disciplines:
- Know your audience – the hype word here is personalisation
- Content with storytelling – the hype word is Content is King
- Measuring and analysing results – the hype word is Business Intelligence
What perplexes me is that each of these components seem to be addressed separately depending on what is the hottest trend on the various expert forums and conferences aimed at marketers. Add the #InternetOfThings to the mix and it gets even more disassociated from the real business purpose of marketing.
Getting personal
What if marketers listened to their data before they applied it to a mailing list with names, company size and job title? Personal contact information provided over completed online forms tends to be incorrect, flimsy and incomplete. Often it is contaminated in the mailing application by duplicates and record matching, and the risk of antagonizing the recipient is real.
Personalisation should not be about getting the name and job title right, it should be about getting personal to the extent that the timing, the message and the format is relevant to the person receiving the communication.
Get aligned – or perish
What if marketers worked their way backwards from the business objectives to the content that was needed and embraced by the sales organisation to achieve them?
Studies show that despite “Content is King”, many sales teams do not fully utilize these carefully drafted assets:
Only 9 percent of content created in enterprise marketing departments is viewed more than five times by the sales department, according to Docurated’s latest State of Sales Enablement report.
Apart from an apparent lack of strategy around content creation, marketing and sales teams are not communicating and appear to be creating content in silos. Read more here.
How to turn metrics and analyses into actionable insights
The good news is that organizations are collecting and creating more data, but they also have better analytics tools and techniques available. The bad news is that there can be too much of a good thing. Paul Blasé from PriceWaterhouseCoopers explains it like this:
“For example, they (…the senior management…) can debate, ‘well why did the market grow at this rate when I assumed [it would grow] at this rate; or why did this competitor gain share versus me, when I assumed the opposite would happen because I dropped my price? It’s about combining the intuition and the experience with the science of data analytics together to help an executive team make better decisions, and that’s where we’re seeing traction.”
The challenge is to allow the poetry to enter the discussion – expressed by Blasé as combining intuition with experience. Because what characterises these questions is that executives tend to address historical data with lagging indicators and based on KPIs and other metrics they defined not from insights they need, but from data that is available to them within the scope of the reporting and analytics tools that they currently use.
The Harvard Business Review conducted an interesting study among graduates who were in positions where the focus was on researching competitive intelligence. And concluded that only half of the companies actually use the competitive intelligence that they collect.
Why? Because when decisions are made, he or she who shouts the loudest, normally defines the game. So if data is collected and interpreted only to reconfirm an assumption or justify a strategy already defined, or if the actual data provides insights that are countering the loudest shouter, management may end up making some very bad decisions. But you can turn it around – if you listen and understand what the data tells you, successful decisions will help your business and your career. One of the examples from the Harvard Business Review study is from a pharmaceutical company that used the data to make business related decisions:
A common theme across industries was the smart reallocation of resources. One analyst told us that their company had stopped development on a project that was consuming lots of local resources after the analysis indicated it wouldn’t be effective. They then re-applied those resources to an area with true growth potential — that area is now starting to take off. In a different company, an analysis led to the cancellation of an extremely high-risk R&D program. (Benjamin Gilad, Leonard M. Fuld, Harvard Business Review Jan 28, 2016)
Read more about why organizations struggle to get data cultures right in this article by David Weldon from Information Management.
From chaos to order
In the second half of this video the SBI (Sales Benchmark Index) Revenue Growth Maturity Model defines the evolutionary flow from data strategy chaos to order:
- Chaos – the organisation has a corporate data strategy but it is not translated into a functional direction.
- Defined – there is both a corporate and functional strategy, but they are not implemented.
- Implemented – now, the strategies for both corporate and functions are implemented but remain separate entities and not aligned.
- Managed – now we have aligned the strategies to run the organisation with a defined goal and actionable insights
- Predictable – aligned both internally within the organisation and including and integrating external data sources from the market.
According to SBI, 51% of US companies are still at level 1 – in a chaotic environment where strategy is neither communicated nor aligned with the business.
That is the pitfall that digital marketers must avoid – the disalignment of business objectives and marketing strategy.
