“I don’t believe in no-win scenarios.” (James T. Kirk, Starship Captain)
When you are a strong believer in datadriven decision making, building strategies on real insights, and always sticking to facts rather than fiction – it’s a hard blow when one of the world’s leading artificial intelligence systems tells you, that you are not a nice person. It’s based on data – so it’s a fact.
Many industry leaders have evangelists who are excellent presenters and subject matter experts. It’s always a privilege when you get a chance to interview an evangelist. I met IBM’s Rashik Parmar, Watson evangelist, at IPExpo Nordic a few weeks ago.
Source: IBM
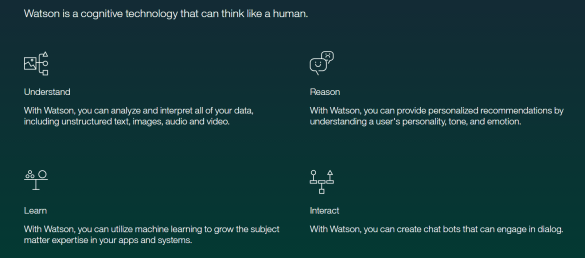
There is so much potential for big data analysis and the learnings and insights we gain, from combining the many available sources of accssible data to draw new conclusions and find answers. That’s basically what Watson does. And then makes the logical connections. Simply put.
IBM developed a small demo engine that would analyse your Twitter personality and generate those awesome charts we all love; and few of us know how to interpret. It was reassuring to see what a nice guy President Obama is on Twitter. And my friend, Rashik, had a similar profile – so all good.
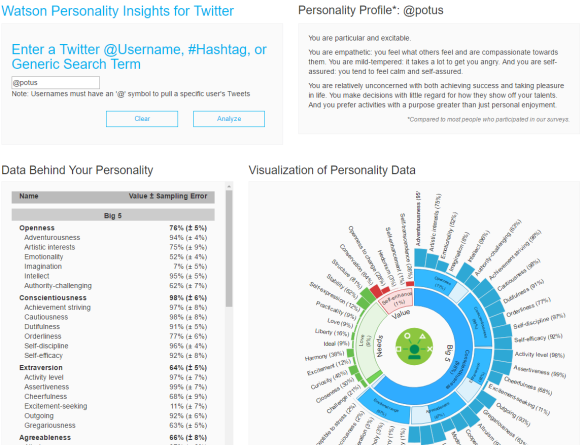
Source: IBM’s demo app TweetMeWatson
Lucky for me, we couldn’t make it work for my profile until I got home. When I ran it, I found out I was
“Inconsiderate and a bit shrewd”
I will spare you the rest. Either I am very delusional about how I express myself, or there was something fishy going on here. But it’s based on data! It has to be true!
Before digging a hole in the garden to hide from the world – or the equivalent: deleting my Twitter account – I decided to think it through. What was Watson picking up on, what were the actual parameters used?
The Big Five (FFM) Personality Traits
Watson is grouping our personalities according to the Five Factor Model (FFM) Wikipedia explains:
The Big Five personality traits, also known as the five factor model (FFM), is a model based on common language descriptors of personality (lexical hypothesis). These descriptors are grouped together using a statistical technique called factor analysis (i.e. this model is not based on experiments).
This widely examined theory suggests five broad dimensions used by some psychologists to describe the human personality and psyche.[1][2] The five factors have been defined as openness to experience, conscientiousness, extraversion, agreeableness, and neuroticism, often listed under the acronyms OCEAN or CANOE. Beneath each proposed global factor, a number of correlated and more specific primary factors are claimed. For example, extraversion is said to include such related qualities as gregariousness, assertiveness, excitement seeking, warmth, activity, and positive emotions.
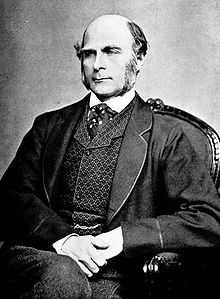 It all sounds very reassuring, the term “Lexical Hypothesis” makes sense – it was analysing words. This is a principle which was developed by British and German psychologists to identify a personality characteristic. It was used to determine risk of mental illness or criminal behaviour. Invented in 1884, by the way, by Sir Fancis Galton – a stern looking fellow.
But something as elusive and intangible as the human mind is so very hard to classify and illustrate in data points and charts. By creating a lexicon of words and adjectives that at the time were considered to be indicators for certain behaviours, they provided a tool to build profiles – and categorise people based by their choice of words.
Note that the method has also received a lot of criticism – many of them quite reassuring when you are on the receiving end of this exercise. Read more here.
Phew – that means I can still be a nice person, just not when I tweet. Or speak.
It seemed safe to climb back out of the hole in the garden and meet the world face on. But knowing now what triggered my unpleasant profile, I decided to challenge Watson to a duel.
A duelling experiment

@echrexperiment is the experimental Twitter profile where tweets were worded more carefully, where people and followers were thanked and nothing bad was happening in the world. No politics, no injustice, no gender inequality, no discrimination. And lots of cats.

After three weeks, I was a much nicer person. The traits that I seem to be exploiting negatively in my original profile are now contributing to a positive image.
Suddenly, uncompromising was a good thing.

“In academic vernacular, you cheated”
Like Captain James T. Kirk in Star Trek challenging Mr. Spock’s designed program, I cheated to win.
Most of my tweets were carefully drafted using positive semantics but remaining true to my usual topics of interest. I was not trying to be someone else, just focusing on being nice. Here’s a list of the parameters I introduced to make Watson love me more:
- Following back – anyone who followed me, unless an obvious business account or egghead, was followed back as soon as I spotted them.
- #FF – sometimes I used the FollowFriday hashtag to thank select people. It generated some nice interactions even between those mentioned, so I grouped them into categories – e.g. Danes, analysts, etc.
- I thanked, and loved, and “awesome’d” and “great’ed” a lot.
- Sharing – giving credit, not taking it. I always mentioned the source or the account where I had picked up a link.
- Sharing the love – retweets were focused on positive news, positive sentiments and uplifting current events. I also checked the wording of the original tweet before RT’ing to avoid contamination of my positivity.
- Getting personal – my personality and emotions were conveyed more by sharing private interests such as books, cats, travel and science fiction.
- Language Disclaimer – all of the above choices were based on my non-native perception of the English language, and may have been different from Webster’s Dictionary which is the basic semantic interpreter used in lexical hypothesis.
What I didn’t do
Humour doesn’t travel well, so any jokes, irony, satire and cartoons were not part of echrexperiment. I may have gotten carried away occasionally, but consciously tried to avoid it.
Politics are a powerful emotional trigger, so I avoided RT’ing or engaging in conversations with political statements. That wasn’t the mission.
Automation is a powerful tool to increase the quantity of your social media posts, but with automation things like timing and engagement suffer. Sometimes, due to other news, automation may even lead to displaying insensitivity.
Automatic response is a convenient way to further promote your services and invite people to connect. But it just isn’t personal. Despite all these lovely people addressing me by name. I did not send messages to thank people for the follow, but I checked their profile and retweeted where I could to show my appreciation.
What Watson had to say about @echrexperiment
The app itself produces a lot of detail as you can see from above. Below I grouped the result into more familiar charts to share some highlights. To make sure I picked a really nice person as control, I chose President Obama’s Twitter @potus. But please remember – it’s probably mostly his staff tweeting. And they seem to have done an excellent job.
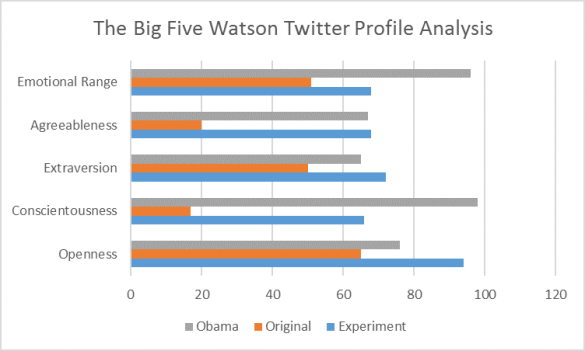
Obama – it appears – is very agreeable on Twitter, and my experimental lovely/nicey/catsy account matches this impression very nicely. We are both very open, although I am lagging on conscientousness, but hey – I am not the President.
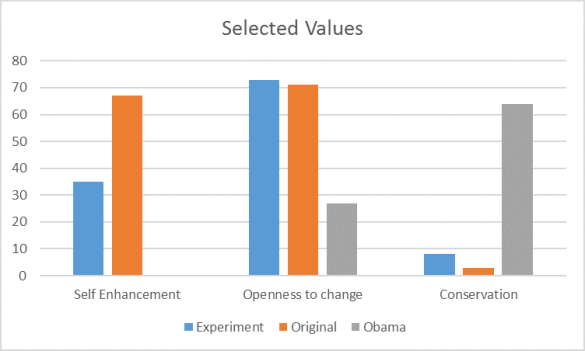
Digging deeper into selected parameters, revealed some interesting characteristics related to being a President or just trying to be a nice person.
We can all agree that values should be an important parameter if you are President of the United States. Strangely enough Obama wasn’t all that keen on change, and more inclined to be conservative. For self enhancement … we have identified the villain – the one parameter that makes my original Twitter account so repugnant. I leave the graph to stand on its own.
Meanwhile, President Obama scored a resounding Zero on self-enhancement – but he made it to the top already.
President Obama’s most distinguishing need is the need for structure. Love – it seems – he gets a plenty.
On the other hand, my original self seems to have enough structure in her life.
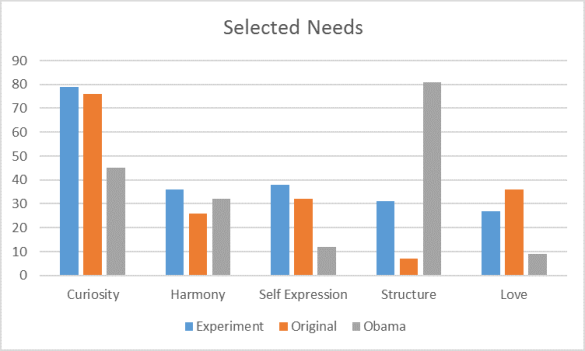
But here’s the greatest insight from this entire exercise – other than confirming that it is possible to change who you are, or rather how you are perceived:
When it comes to curiosity, all you need to do is be a positive tweeter and include lots of cats.